Language has a pretty interesting property known as Zipf’s Law. That is, language data (and even subsets of language data) have a Zipfian distribution. There are a small number of highly frequent words, and a large number of highly infrequent words. Moreover, the frequent words tend to be short, grammatical (words that are grammatically required but don’t really mean anything) and the infrequent words tend to be longer, lexical (words like nouns and verbs which have some sort of referent or meaning).
What does this mean? Well, to show you I downloaded all of the English wikipedia (and you can too here). The entire wikipedia data dump is a pretty sizable dataset (a couple billion words), but I just took a sample of 36.8 million words to make dealing with the data a little faster and easier. Still, it’s safe to say it’s probably a statistically significantly large dataset. In those 36.8 million word tokens there are over 580,000 word types – everything from people city names to city names to obscure plant and disease names and more common words like the ones you’re reading right now. Of those 580,000, nearly half (280,000) occur just once in the sample.
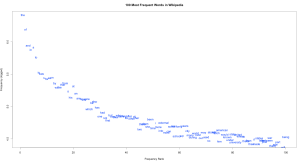
After some cleanup (getting rid of numbers and punctuation and such), I used R to do a bit of number crunching and graph-making. Here you can see the 100 most frequent words of the sample (click the image to see a larger version):
As you can see, it follows a neat logarithmic curve. And you can also see that most of these words are generally short and grammatical. For example, the occurs 2.4 million times in the 36.8 million word sample: over 6% of all the words you read on wikipedia is the word “the”! Next we have of, occurring nearly 1.3 million times (that’s over 3% of the words you read!), followed by and, occurring just 1 million times (a bit less than 3% of the words). As we get lower on the graph, we start to see lexical words like american, state, university, and war, each occurring around 30,000 times. These are probably a reflection of the articles I happened to pull in my random sample, and not a reflection of the English language as a whole.
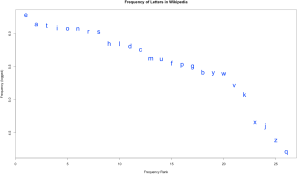
Zipf’s Law doesn’t just work on words, it works on just about any subset of language data. Let’s try letters:
At around 5 letters per word, 36.8 million words would have something like 200 million letters, which is a bit too much data for my computer to handle. So for this graph I used just 3 million words. But again, we see the logarithmic curve, with E occurring almost 2 million times (nearly twice for every three words, on average), and Q occurring just 16,000 times. This distribution also gives you a sense for why certain letters are worth more in games like Scrabble and Words with Friends.
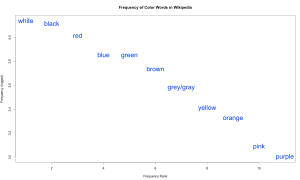
Let’s try just the color words from the original 36.8M word sample:
Again, the logarithmic curve. Interestingly, the rank order more or less follows Berlin & Kay’s hierarchy of color terms.
When learning a second language, people learn better if they’re taught new vocabulary with a Zipfian distribution than if they’re forced to try to remember all words equally well.
Another cool thing about Zipfian distributions is that is seems dolphin communication shares this trait with us.
But, Zipf’s law isn’t the be-all-end-all of language. Lots of things have this curve (populations of cities, for example). So, as with all statistics, take it with a grain of salt.


You must be logged in to leave a reply.