T11021199_10103411507214023_8653118442359345632_n
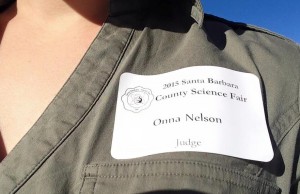
oday I volunteered as a judge for the Junior Division of Social, Behavioral, and Cognitive Sciences at the local County Science Fair!!

Even though I had to get up an hour and a half earlier than I normally do, it was totally worth it! I learned that if you feed ants aspartame, they don’t build tunnels that are as deep as ants that are fed sugar. I learned that praising preteens based on their effort (“You worked hard!”) is better for their confidence and willingness to try a harder puzzle than if you praise their innate ability (“You’re smart!”) or remain neutral (“You completed the puzzle!”). I also learned that people pay much more attention to the number of stars an online review has than just about any other information, and that special needs children work better when listening to rap music than when listening to classical or no music.

I’ll definitely do this again next year!

More »

A while ago, I scraped the LINGUIST List job pages and made a set of graphs for the Linguistics Club here at UCSB, to give the undergrads an idea of where the jobs are in linguistics. It turns out, Language Log did a similar thing, but focusing just on academic jobs and comparing the number of those jobs to the number of fresh PhDs in linguistics.

More »

As part of the Developing Data Products class at Coursera, we’ve been encouraged to share our R Shiny apps on twitter using the #myDataProduct hashtag! I tweeted mine and blogged about it already. I’ve also blogged about word clouds in R. And lo and behold, someone did both! @dscorzoni combined Shiny and word clouds into a nifty little app that takes a URL and generates a word cloud from it! How cool!!

Did you know that over 90% of the wine produced in the United States is made right here in California? I just learned that.

Sometimes, you randomly are in the depths of the internet and you find some data in a hideous table and you just *have* to visualize it! Here’s a brief how-to with some fun data on wine!!

More »

My friend recently asked me how I make word clouds for presentations. Wordle is definitely a good choice. WordPress automatically makes word clouds out of my tags in the sidebar. But sometimes you can’t or don’t want to upload your data to places like WordPress or Wordle and you just want to use R (because you use R for everything else, so why not? Or is that just me?).

In a typical word cloud, word frequency is what determines the size of the word. As of this writing, the word cloud in my side bar (over there ) has “linguistics” and “programming” as clearly the largest words. Tags like “video games,” “language,” and “education” are also pretty big. There are also really small words like “Navajo” and “handwriting.” This reflects the frequency of each tag. Bigger tags are more frequent, so I write about linguistics a lot but not so much about Navajo in particular.

More »