American tax law is ridiculously over-complicated and there is a lot of misinformation and scams out there. I’m not a lawyer, I’m no longer a certified tax professional (although I used to be), and this is just my opinion and personal experience. But I’m really frustrated seeing these particular myths so often.
As part of the Developing Data Products class at Coursera, we’ve been encouraged to share our R Shiny apps on twitter using the #myDataProduct hashtag! I tweeted mine and blogged about it already. I’ve also blogged about word clouds in R. And lo and behold, someone did both! @dscorzoni combined Shiny and word clouds into a nifty little app that takes a URL and generates a word cloud from it! How cool!!
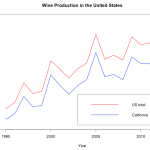
Did you know that over 90% of the wine produced in the United States is made right here in California? I just learned that.
Sometimes, you randomly are in the depths of the internet and you find some data in a hideous table and you just *have* to visualize it! Here’s a brief how-to with some fun data on wine!!
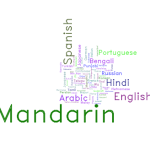
My friend recently asked me how I make word clouds for presentations. Wordle is definitely a good choice. WordPress automatically makes word clouds out of my tags in the sidebar. But sometimes you can’t or don’t want to upload your data to places like WordPress or Wordle and you just want to use R (because you use R for everything else, so why not? Or is that just me?).
In a typical word cloud, word frequency is what determines the size of the word. As of this writing, the word cloud in my side bar (over there →) has “linguistics” and “programming” as clearly the largest words. Tags like “video games,” “language,” and “education” are also pretty big. There are also really small words like “Navajo” and “handwriting.” This reflects the frequency of each tag. Bigger tags are more frequent, so I write about linguistics a lot but not so much about Navajo in particular.


