
TL;DR: tweet linguistics and cognitive science wikipedia stubs to @wugology!
Why do I want you to tweet me wikipedia stubs? More »
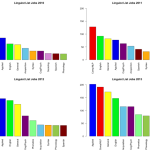
A while ago, I scraped the LINGUIST List job pages and made a set of graphs for the Linguistics Club here at UCSB, to give the undergrads an idea of where the jobs are in linguistics. It turns out, Language Log did a similar thing, but focusing just on academic jobs and comparing the number of those jobs to the number of fresh PhDs in linguistics.
As part of the Developing Data Products class at Coursera, we’ve been encouraged to share our R Shiny apps on twitter using the #myDataProduct hashtag! I tweeted mine and blogged about it already. I’ve also blogged about word clouds in R. And lo and behold, someone did both! @dscorzoni combined Shiny and word clouds into a nifty little app that takes a URL and generates a word cloud from it! How cool!!
I’m taking a course called Developing Data Products at Coursera as part of the Data Science Specialization. We just learned out to make interactive graphs using Shiny, and I’m kind of obsessed. I made one using data about how long it really takes for PhD students to get their degree. You can play with it here!
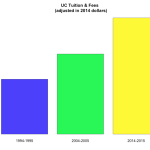
Of all the books I read in high school to prepare for college, How to Lie with Statistics by Darrel Huff was, by far, the best. It’s actually not encouraging lying with statistics. Rather, it encourages you to think when you see a statistic, and question whether the data are presented in such a way that it leads the reader to a false conclusion. It teaches the kind of critical thinking and questioning authority that’s essential for success in academic research, and it’s written at a level that most high schoolers could understand.
Let me demonstrate with two small datasets: More »
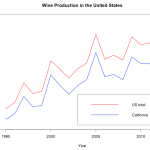
Did you know that over 90% of the wine produced in the United States is made right here in California? I just learned that.
Sometimes, you randomly are in the depths of the internet and you find some data in a hideous table and you just *have* to visualize it! Here’s a brief how-to with some fun data on wine!!
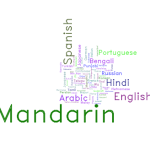
My friend recently asked me how I make word clouds for presentations. Wordle is definitely a good choice. WordPress automatically makes word clouds out of my tags in the sidebar. But sometimes you can’t or don’t want to upload your data to places like WordPress or Wordle and you just want to use R (because you use R for everything else, so why not? Or is that just me?).
In a typical word cloud, word frequency is what determines the size of the word. As of this writing, the word cloud in my side bar (over there →) has “linguistics” and “programming” as clearly the largest words. Tags like “video games,” “language,” and “education” are also pretty big. There are also really small words like “Navajo” and “handwriting.” This reflects the frequency of each tag. Bigger tags are more frequent, so I write about linguistics a lot but not so much about Navajo in particular.

When I enrolled as a freshman in college, I registered as a linguistics major but I had a notion that I would minor in computer science. Computer science seemed interesting and well-paying and I didn’t even know computational linguistics was a thing at the time. I just liked computers. I never had a problem switching between Macs and PCs. I liked to peak inside computers and replace the RAM and things like that. I had poked around with HTML editors. The classes on things like graphic design and artificial intelligence and stuff seemed really cool.
I looked up the prerequisites and found that to minor in CS you had to actually get pretty far in math, at least through Calculus C and one or two courses of Linear Algebra. So, naturally, I signed up for Calculus A my fall term.
Tonight will be the American Dialect Society’s annual vote for The Word of the Year!! Unfortunately, I’m not in Portland to vote. The list of nominees are here. My picks?
Welcome to Spring Semester or Winter Quarter everybody!
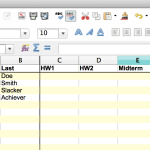
A new term means new students, new courses, and new spreadsheets to keep track of everything! Today I just wanted to share two quick things I use to organize my class spreadsheets. This works in Excel, OpenOffice, and LibreOffice. I’ve never used Numbers, but it probably works there too. Later this month I’ll share a small amount of programming that will help you calculate final grades at the end of the course! :)